By creating plots in the plot pilot, an URL is generated to enable the external incorporation of plots. They can be integrated as live-plots in websites, dashboards or word documents. Plots will then be automatically updated when they are modified or new operational data is imported.
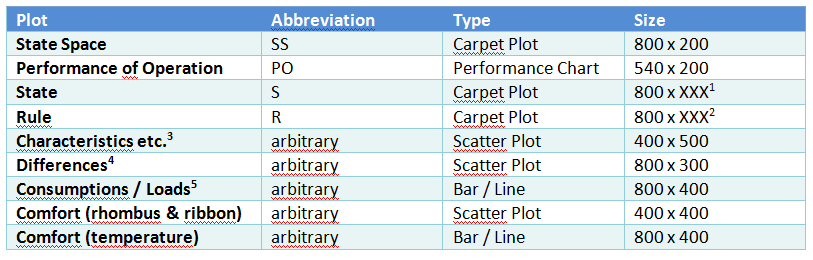
This table shows some reference values of applicable formats for the integration of plots in websites and dashboards.
[1] Height variable depending on number of rules.
[2] Height variable depending on number of states.
[3] e.g. supply temperature as a function of the ambient air temperature etc.
[4] e.g. difference of supply- and return temperature as a function of the ambient air temperature etc.
[5] Consumption should preferably displayed in combination with the ambient air temperature (as line; daily mean).