![]() Performance data or results from functions and rules can be aggregated over time by metrics. The result of a metric will always be displayed on the first value of a time period. Nevertheless the resulting sensor represents the complete time series. Points of time without values are denoted as MV (missing value).
Performance data or results from functions and rules can be aggregated over time by metrics. The result of a metric will always be displayed on the first value of a time period. Nevertheless the resulting sensor represents the complete time series. Points of time without values are denoted as MV (missing value).
Following base functions are available:
- arithmetic average
- maximum
- minimum
- sum
- difference
- evaluation (suitable for the evaluation of state spaces)
- number of valid values
- number of invalid values
- median
- standard deviation
- variance
Additionally the quantization of the metric has to be chosen:
- hour
- day
- week
- month
- quarter
- year

As a third configuartion of the metric, an interval has to be defined. An open interval can be used for the function „difference“. All other base functions use closed intervals.
Examples for metrics:
M etric: Average
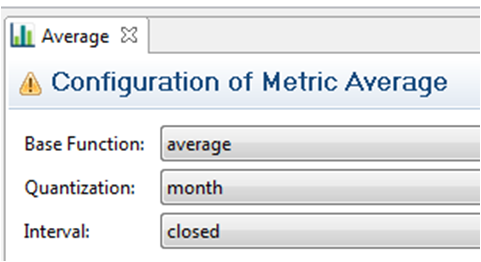
Result = (sum of all values of the time period) / (number of all values of the time period)
Example:
37528 (sum of all values of april); 2880 (number of values in april)
= 37528 / 2880 = 13,03
Metric: Difference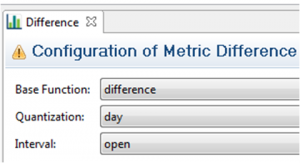

result = (first value of the time period) – (first value of the prior time period)
Example:
14386 (meter reading 01/05/12 00:00)
14123 (meter reading 01/04/12 00:00)
= 14386-14123 = 263
Metric: Evaluation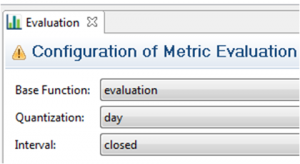
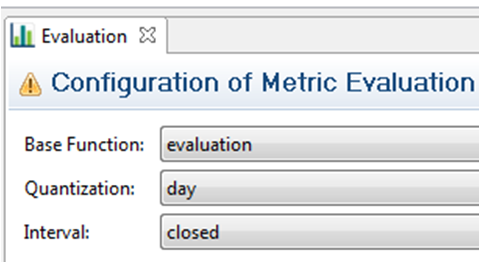
result = number of valid values / number of total values
Example:
63 valid values per day / 96 possible values per day
= (63 / 96) * 100 %
= 65,6 %